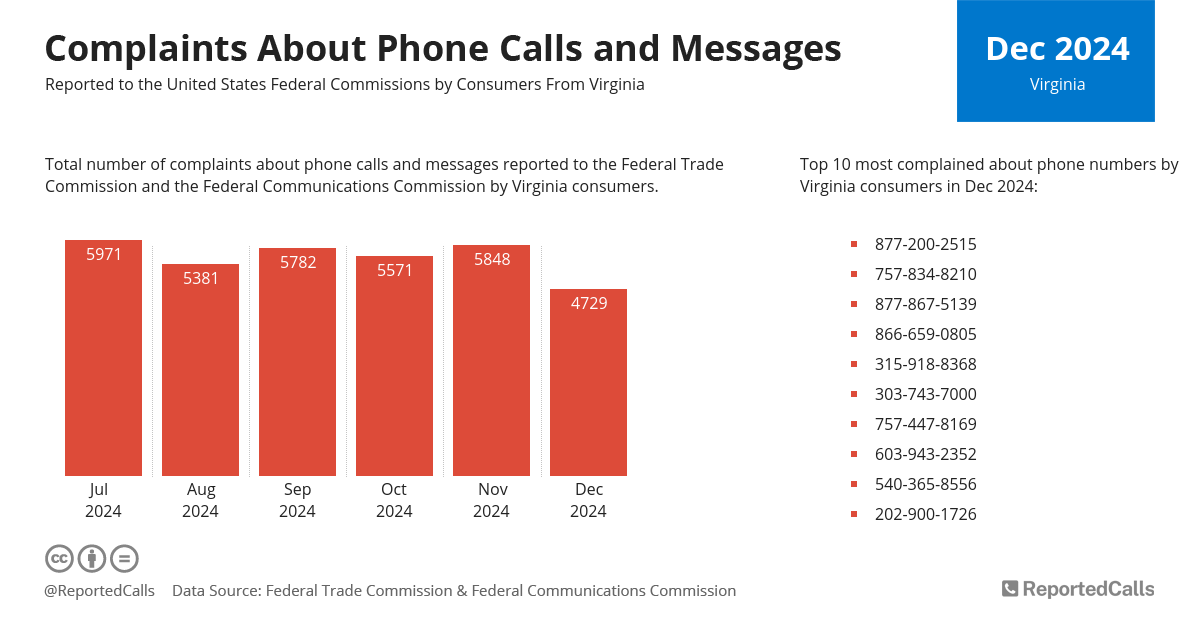
In December 2024, consumers from Virginia filed 4316 complaints about phone calls and text messages, down 26% from the previous month.
| Jul 2024 |
5971 |
|---|---|
| Aug 2024 |
5381 |
| Sep 2024 |
5782 |
| Oct 2024 |
5571 |
| Nov 2024 |
5848 |
| Dec 2024 |
4316 |
| Complaints | FTC | FCC |
|---|---|---|
| July 2024 | 5971 | 0 |
| August 2024 | 5381 | 0 |
| September 2024 | 5782 | 0 |
| October 2024 | 5571 | 0 |
| November 2024 | 5848 | 0 |
| December 2024 | 4316 | 0 |
Robocalls and Recorded Messages
Data show, that last month 63% of the Virginia consumer complaints received by the Federal Trade Commission were about a recorded message or robocall.
| July 2024 |
31% | 61% | |
|---|---|---|---|
| August 2024 |
33% | 58% | |
| September 2024 |
35% | 57% | |
| October 2024 |
33% | 60% | |
| November 2024 |
34% | 59% | |
| December 2024 |
33% | 63% |
| Answers | Yes | No | N/A |
|---|---|---|---|
| July 2024 | 61% | 31% | 8% |
| August 2024 | 58% | 33% | 9% |
| September 2024 | 57% | 35% | 8% |
| October 2024 | 60% | 33% | 7% |
| November 2024 | 59% | 34% | 7% |
| December 2024 | 63% | 33% | 4% |
Reported Phone Numbers
Top 10 most complained about phone numbers and the number of complaints they received from Virginia in December 2024:
| Phone | Complaints |
|---|---|
| 877-200-2515 | 27 |
| 757-834-8210 | 23 |
| 877-867-5139 | 18 |
| 866-659-0805 | 16 |
| 315-918-8368 | 10 |
| 303-743-7000 | 10 |
| 757-447-8169 | 10 |
| 603-943-2352 | 8 |
| 540-365-8556 | 8 |
| 202-900-1726 | 7 |
Browse other phone numbers starting with the Virginia area code: 276, 434, 540, 571, 686, 703, 757, 804, 826, 948.
Share Statistics
Inform Others
Complaints from Virginia statistics
Download ChartURL to be used as a reference link:
https://www.reportedcalls.com/virginia
HTML code to embed chart on your website:
Data Source: complaint figures are based on the complaint data released by the Federal Trade Commission (FTC) and the Federal Communications Commission (FCC).