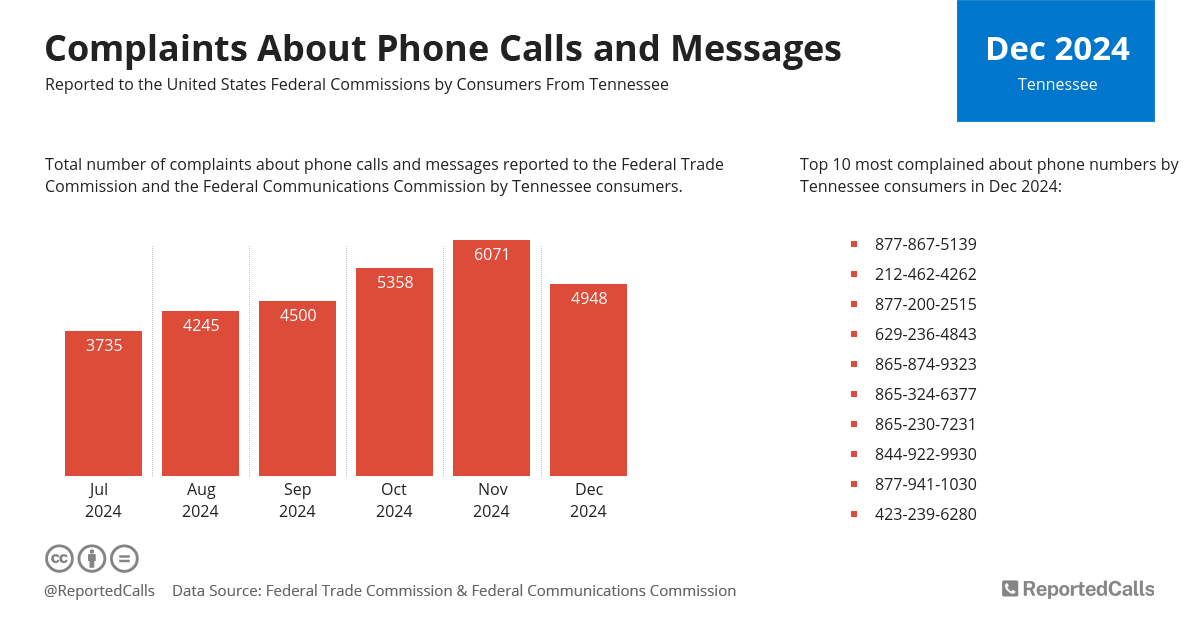
In December 2024, consumers from Tennessee filed 4428 complaints about phone calls and text messages, down 27% from the previous month.
| Jul 2024 |
3735 |
|---|---|
| Aug 2024 |
4245 |
| Sep 2024 |
4500 |
| Oct 2024 |
5358 |
| Nov 2024 |
6071 |
| Dec 2024 |
4428 |
| Complaints | FTC | FCC |
|---|---|---|
| July 2024 | 3735 | 0 |
| August 2024 | 4245 | 0 |
| September 2024 | 4500 | 0 |
| October 2024 | 5358 | 0 |
| November 2024 | 6071 | 0 |
| December 2024 | 4428 | 0 |
Robocalls and Recorded Messages
Data show, that last month 50% of the Tennessee consumer complaints received by the Federal Trade Commission were about a recorded message or robocall.
| July 2024 |
40% | 51% | |
|---|---|---|---|
| August 2024 |
37% | 55% | |
| September 2024 |
37% | 42% | |
| October 2024 |
40% | 42% | |
| November 2024 |
36% | 48% | |
| December 2024 |
37% | 50% |
| Answers | Yes | No | N/A |
|---|---|---|---|
| July 2024 | 51% | 40% | 8% |
| August 2024 | 55% | 37% | 7% |
| September 2024 | 42% | 37% | 20% |
| October 2024 | 42% | 40% | 19% |
| November 2024 | 48% | 36% | 16% |
| December 2024 | 50% | 37% | 13% |
Reported Phone Numbers
Top 10 most complained about phone numbers and the number of complaints they received from Tennessee in December 2024:
| Phone | Complaints |
|---|---|
| 877-867-5139 | 18 |
| 212-462-4262 | 14 |
| 877-200-2515 | 8 |
| 629-236-4843 | 6 |
| 865-874-9323 | 6 |
| 865-324-6377 | 6 |
| 865-230-7231 | 6 |
| 844-922-9930 | 5 |
| 877-941-1030 | 5 |
| 423-239-6280 | 5 |
Browse other phone numbers starting with the Tennessee area code: 423, 615, 629, 731, 865, 901, 931.
Share Statistics
Inform Others
Complaints from Tennessee statistics
Download ChartURL to be used as a reference link:
https://www.reportedcalls.com/tennessee
HTML code to embed chart on your website:
Data Source: complaint figures are based on the complaint data released by the Federal Trade Commission (FTC) and the Federal Communications Commission (FCC).