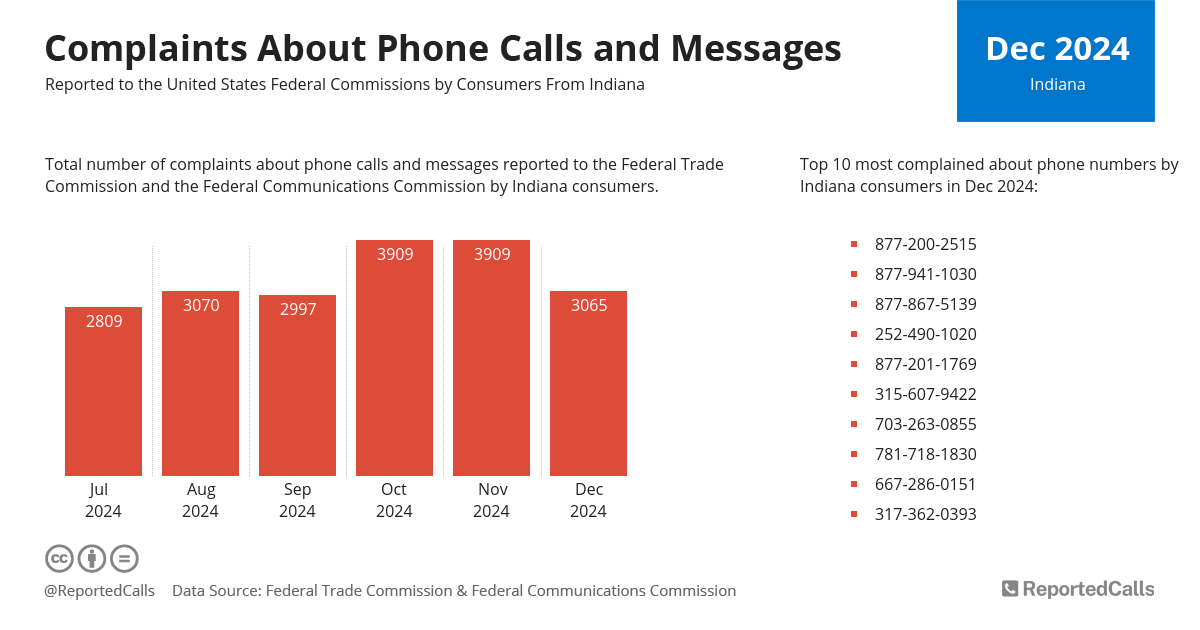
In December 2024, consumers from Indiana filed 2803 complaints about phone calls and text messages, down 28% from the previous month.
| Jul 2024 |
2809 |
|---|---|
| Aug 2024 |
3070 |
| Sep 2024 |
2997 |
| Oct 2024 |
3909 |
| Nov 2024 |
3909 |
| Dec 2024 |
2803 |
| Complaints | FTC | FCC |
|---|---|---|
| July 2024 | 2809 | 0 |
| August 2024 | 3070 | 0 |
| September 2024 | 2997 | 0 |
| October 2024 | 3909 | 0 |
| November 2024 | 3909 | 0 |
| December 2024 | 2803 | 0 |
Robocalls and Recorded Messages
Data show, that last month 56% of the Indiana consumer complaints received by the Federal Trade Commission were about a recorded message or robocall.
| July 2024 |
39% | 45% | |
|---|---|---|---|
| August 2024 |
42% | 40% | |
| September 2024 |
37% | 45% | |
| October 2024 |
29% | 56% | |
| November 2024 |
30% | 51% | |
| December 2024 |
30% | 56% |
| Answers | Yes | No | N/A |
|---|---|---|---|
| July 2024 | 45% | 39% | 16% |
| August 2024 | 40% | 42% | 18% |
| September 2024 | 45% | 37% | 19% |
| October 2024 | 56% | 29% | 15% |
| November 2024 | 51% | 30% | 19% |
| December 2024 | 56% | 30% | 14% |
Reported Phone Numbers
Top 10 most complained about phone numbers and the number of complaints they received from Indiana in December 2024:
| Phone | Complaints |
|---|---|
| 877-200-2515 | 11 |
| 877-941-1030 | 9 |
| 877-867-5139 | 8 |
| 252-490-1020 | 6 |
| 877-201-1769 | 5 |
| 315-607-9422 | 4 |
| 703-263-0855 | 4 |
| 781-718-1830 | 4 |
| 667-286-0151 | 4 |
| 317-362-0393 | 4 |
Browse other phone numbers starting with the Indiana area code: 219, 260, 317, 463, 574, 765, 812, 930.
Share Statistics
Inform Others
Complaints from Indiana statistics
Download ChartURL to be used as a reference link:
https://www.reportedcalls.com/indiana
HTML code to embed chart on your website:
Data Source: complaint figures are based on the complaint data released by the Federal Trade Commission (FTC) and the Federal Communications Commission (FCC).